
Markets
Bitcoin (BTC) On-Chain Analysis: Mayer Multiple Shows Bullish Reversal Potential
Be[In]Crypto takes a look at the Mayer Multiple (MM) and its components in order to determine if BTC is close to a bullish trend reversal.
The post Bitcoin (BTC) On-Chain Analysis: Mayer Multiple Shows Bullish Reversal Potential appeared first on BeInCrypto.
Be[In]Crypto takes a look at the Mayer Multiple (MM) and its components in order to determine if BTC is close to a bullish trend reversal.
What is Mayer Multiple?
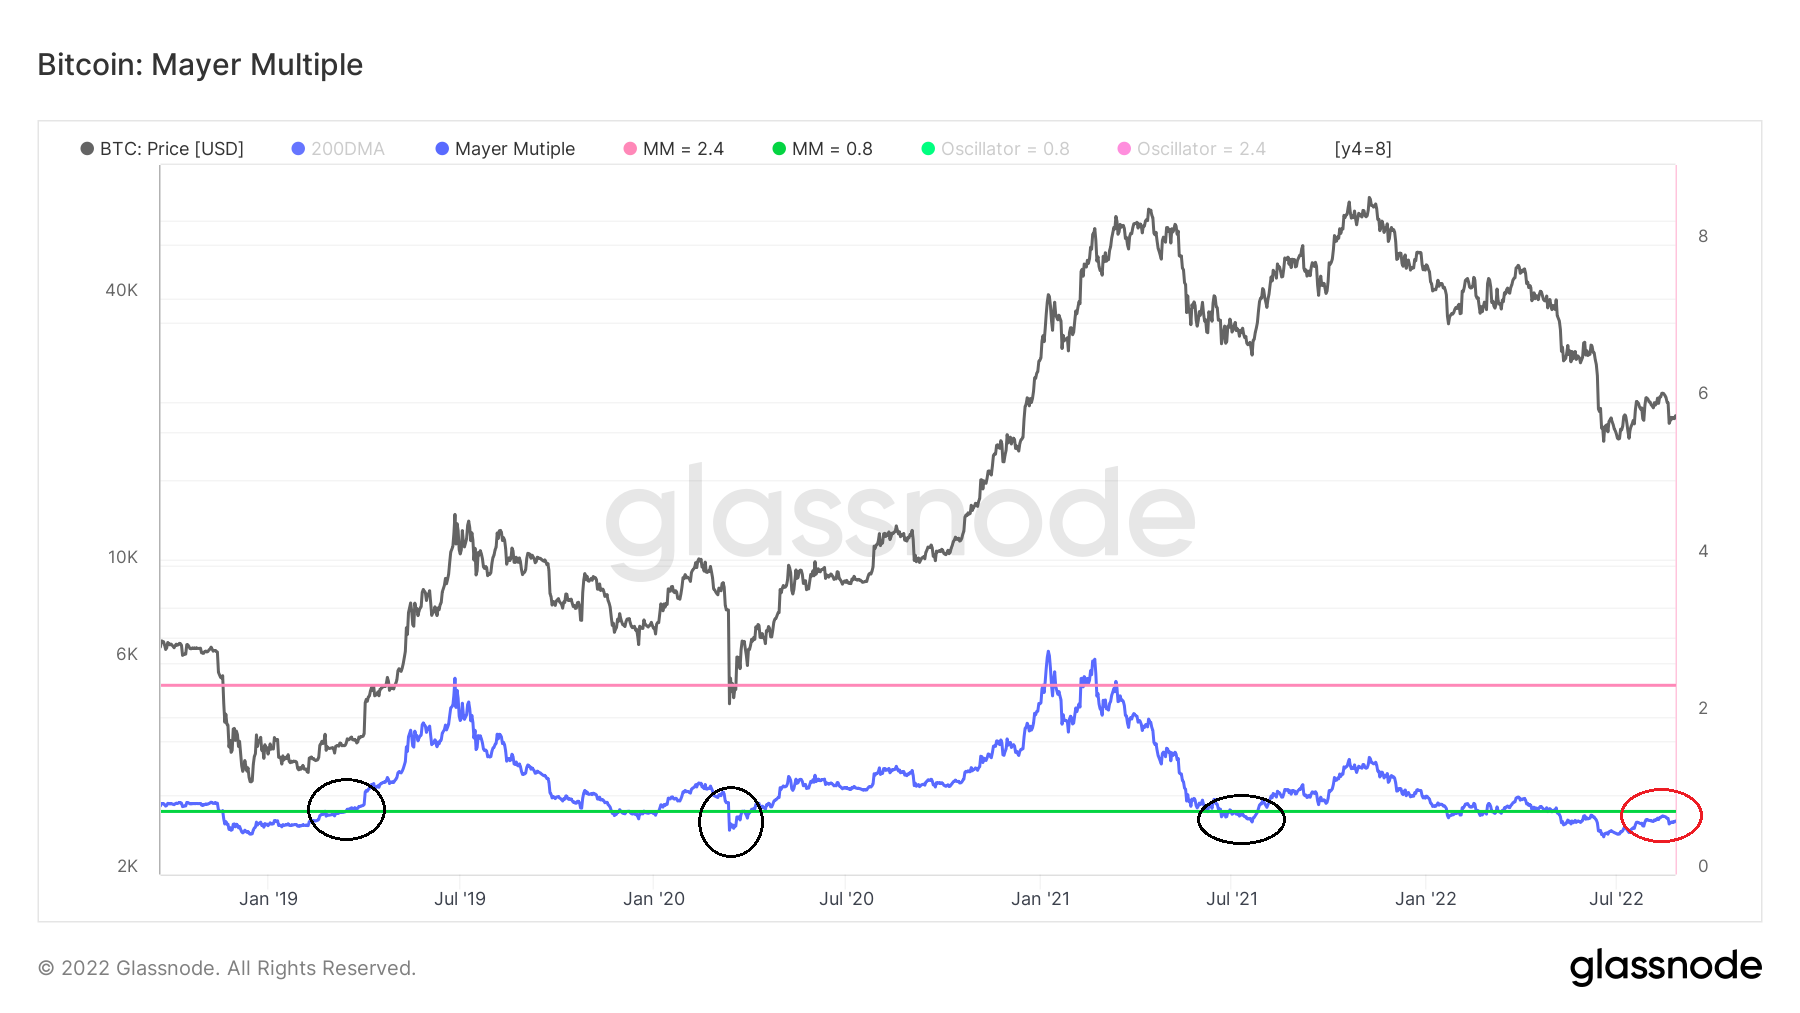
The Mayer Multiple (MM) is an oscillator that is calculated using the ratio between the BTC price and its 200-day moving average (MA).
Afterward, the Mayer Multiple indicator (blue) is afterward created by taking the difference between the BTC price and its 200-day MA. The 0.8 (green) and 2.4 (purple) oscillators are then plotted in order to determine market tops and bottoms.
Movements above the 2.4 oscillators have historically coincided with tops. Conversely, movements below the 0.8 oscillators have coincided with bottoms.
BTC capitulates
As stated previously, sharp breakdowns below the 0.8 oscillators have historically determined bottoms. Usually, these occur after a period in which the indicator moves freely above and below the 0.8 line (black circle).
In the current cycle, the capitulation started on May 5 (red arrow). Afterward, the bottom was reached on June 18, 43 days after capitulation began. This was similar to the length it took for the bottom to be reached in 2015 and much longer than what it took in 2019. In the former, it took the price 50 days to reach a bottom after the MM capitulation. In 2019 only 17 days were required for a bottom to be reached.
 On-Chain Analysis: Mayer Multiple Shows Bullish Reversal Potential")
Potential reversal
Historically, once MM falls below the 0.8 oscillator for good, the ensuing reclaim confirms that a bullish reversal has begun.
This can be clearly seen in March 2019, April 2020, and even July 2021 (black circles).
In the current movement, MM reached a high of 0.74 on Aug. 13 but was rejected (red circle) in the first attempt at moving above the line.
Due to how long the indicator has been below 0.8, a reclaim of this level is expected in the near future. If one occurs, it would confirm that the bullish reversal has begun.
For Be[in]Crypto’s latest Bitcoin (BTC) analysis, click here
The post Bitcoin (BTC) On-Chain Analysis: Mayer Multiple Shows Bullish Reversal Potential appeared first on BeInCrypto.
Source: Markets – BeInCrypto


